All of the code that I used is written in Python and is on my github [Here]. I'd like to think it's pretty readable. You can also run all of the code and reproduce all of my figures in Binder without even having to download anything!
 |
| Look its that thing we made |
For the hackathon we came up with the idea of using the city's public data to improve bus usage in San Diego. We noticed that certain bus routes were either overused, underused, or had surge times. During commute times in San Diego people actually wait in line for the bus. They get to the bus stop and some of the people don't get to even board the bus when it comes because there are too many people. This phenomenon is whack and presents lots of space for improvement.
 |
| Whack bus line somewhere thats not in San Diego |
The Plan
Here's what we set out to do:
* Build an app that the city to use to visualize and analyze bus usage data
* Identify overused, underused, and surging bus lines.
* Explore ways we could partner with rideshare companies to make busses great again (sorry)
We learned that the city of San Diego just started started installing infrared sensors on the doors to the bus to count how many people get on and off bus at each stop. This seemed like a great place to start... but we couldn't get our hands on that data over the weekend with 0 hours notice. Crap.
Well in neuroscience if you want to study something that there is no data for, the best thing you can do is to build a simulation. And by simulation I mean a big 'ol math equation. This math equation will output realistic data by making certain assumptions about the underlying processes that generate it Then you can analyze the simulated data while you tweak the parameters to see what happens.
Here's what I decided were the important features of one day in the life of a bus line:
1. Number of stops
2. Max capacity of the bus
3. How many passengers get on at each stop
4. The stops where the bus fills up
5. Number of surges in the bus line
6. When the surges happen
This seems like a lot of stuff to stuff into a math equation but it's actually not too bad if we assume bus demand is governed by A: some combination of random noise (riders randomly get on and off stops irrespective of the time) and B: oscillations (rider demand increases and decreases over time). I whipped up a simulation of this [here] but if that's not your thing then I guess you can just take my word for it.
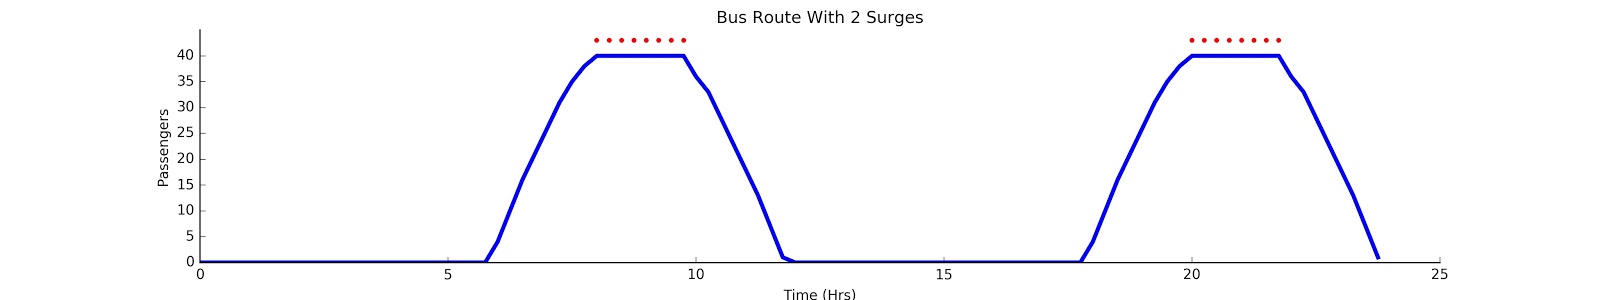
Fake Busses
Using my algorithm I could create daily bus routes and change different things about them. Here are some examples: (blue line is the number of passengers on the bus at each stop, red dots are where the bus reaches capacity of 40)
If I make ridership completely random it looks like this:

And if I make ridership completely oscillatory it looks like this:
Both of those look kind of artificial but if I find the happy medium between noise and oscillations it looks a little more realistic.

The previous models all have the same number of times that they fill up. I can also change the overall demand without changing the timing of demand.
High demand:

Low demand:

Cool. Now we have a bunch of fake buses... Why did we do that again?
We made these so that we can use them as templates for figuring out how to analyze them. If we only have the data, and we don't have access to the parameters that generated it, can we infer them? In other words, is there a way that I can give you numbers that characterize the noisiness, 'surginess', and demand of a bus line?
Demand
Demand is easiest so I'll talk about it first. If we want to know the total passengers who got on a bus in a given day, we just have to find the integral of the number of passengers on the route over time. There is a handy function for that called sum().
The more important feature of demand is how many times the bus filled up. If a bus line has lots of demand but doesn't fill up then thats perfect. I want to know when the bus is too full. I did this by set a threshold at the max capacity in for the bus and each time the amount of passengers on the bus reaches that number I record the times. It looks something like this:

These are two bus routes that both filled up 20 times but the way they filled up over time is totally different. The blue one filled up randomly, but the red one filled up in bursts. It's obvious to a human which is which but if we had 1000 bus lines that we didn't want to manually comb through, could we write an algorithm that would tell us if a bus line is noisy or surgey automatically?
Noise
Yes we can. Some neuroscientists were faced with a similar problem in analyzing spike times in neurons and figured out you can quantify 'burstiness' using the coefficient of variation of the inter-spike intervals (CV).
Check it out. If I take a purely surging bus line and iteratively add a little bit of noise, CV tracks this change pretty well - before it gets too noisy.

Surges
Cool. Now we can use CV automatically tell us how noisy and surgey busy bus lines are. But wouldn't it be helpful to know how many surges there are and when they happen? It would, dear reader, and we can do that pretty well using k-means clustering. If you look through my code you'll see that I tried the traditional approach of finding the optimal k using the elbow method but I couldn't get that to work so I made up my own thing.
Here's an example of my method identifying the surge times in a bus line:

It looks like it works but I totally could have lied so here's a little more proof - here's how it does on bus lines with between 1 and 5 surges and 50% noise:
 |
| Dope |
Summary, Problems, Caveats, and Future Directions
Overall I did a pretty good job. I was successfully able to quantify demand, noisiness, and surges in simulated MTS data. By doing this, I could take large amounts of ambiguous 1's and 0's and turned it into actionable information someone can use to understand and hopefully improve the system.
However, there are some important things to acknowledge. First of all, my simulation is definitely still a little artificial. Bus surges are probably not totally sinusoidal and I don't think surges ever happen at 3:30 AM. This feature shouldn't really affect the way I analyzed the data but it makes the simulations seem a little less genuine. Moreover, as the real data comes in, it might turn out that noise/oscillations are not the best way we can describe demand.
CV is also a pretty finicky measure. It is highly sensitive to both the length of time being analyzed and the total number of points where the busses fill up. I didn't think this would happen and I have been using this measure in real science code so I gotta go make sure it really makes sense.
There are much more sophisticated ways to characterize peaks in the presence of noise, (somebody might even publish an algorithm that does just this for neural oscillations someday). There are also several other machine learning algorithms one could use to analyze bus ridership that I didn't get to for the sake of time. For instance, longitudinal ridership could be clustered over weeks and months, and we could do outlier detection for unusual surges.

Feel free to mess around the code and let me know if I made any mistakes!
No comments:
Post a Comment